LEDGERWIRE DATAUS national debt data
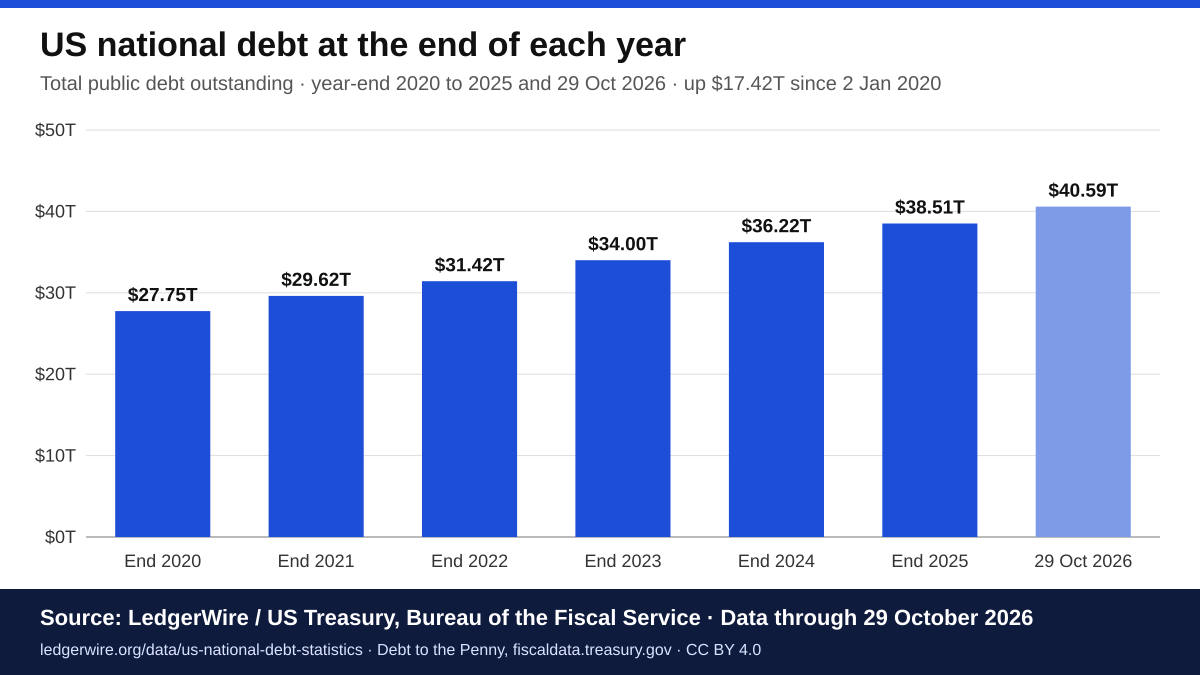
Total US public debt outstanding was $40.59 trillion on 29 October 2026, according to the US Treasury. These pages follow that figure every business day and turn it into statistics, charts and a calculator that anyone can use, cite and link to.
Updated 31 October 2026. Source: U.S. Treasury, Bureau of the Fiscal Service: Debt to the Penny. Figures are refreshed each business day.
Trackers, statistics and tools
Total public debt outstanding stood at $40.59 trillion on 29 October 2026, according to the US Treasury. That is $2.52 trillion more than on 29 October 2025, an average of about $6.9 billion a day.
Daily figures, 30-day and one-year changes, a line chart and the full Debt to the Penny series as a CSV.
46 key figures on the national debt, each with its own link, plus year-end totals from 2020 and the change since 29 October 2025.
Copy-ready citations, two CSV files and a downloadable bar chart.
Total public debt was $40.59 trillion on 29 October 2026, which is $118,355 for every person in the United States.
Work out the share for any household size on any business day since 2 January 2020.
Free downloads
All files are free to reuse under CC BY 4.0 with credit to LedgerWire and the US Treasury, Bureau of the Fiscal Service.
Citable dataset
A dated snapshot of the daily series from 1993 is archived as a research dataset with a permanent DOI: 10.5281/zenodo.23823933. Use it when you need a fixed version for a paper or report; the tracker above always has the latest day.
How to credit LedgerWire
Please credit "LedgerWire / US Treasury, Bureau of the Fiscal Service" and link to the page you used. Each statistic and table row has its own anchor, so you can link straight to the figure you quote.